Getting Started with Weather HAT
Designed for keeping a weather eye on the great outdoors (see what we did there), Weather HAT equips a Raspberry Pi with the functionality to measure temperature, pressure, humidity, light, and (with additional sensors) wind speed, wind direction and rain.
It's an affordable, hackable, fully customisable alternative to traditional weather stations. A big advantage of using a Raspberry Pi to collect weather data is that there are lots of interesting Python APIs available, so it's straightforward to post your weather data into cloud data services or contribute to collaborative weather forecasting efforts like Weather Underground.
In this tutorial, we'll go through what the different parts of the board do, how to attach it to your Raspberry Pi, how to install the Python library and take a look at what some of the code examples do.
What's on Weather HAT?
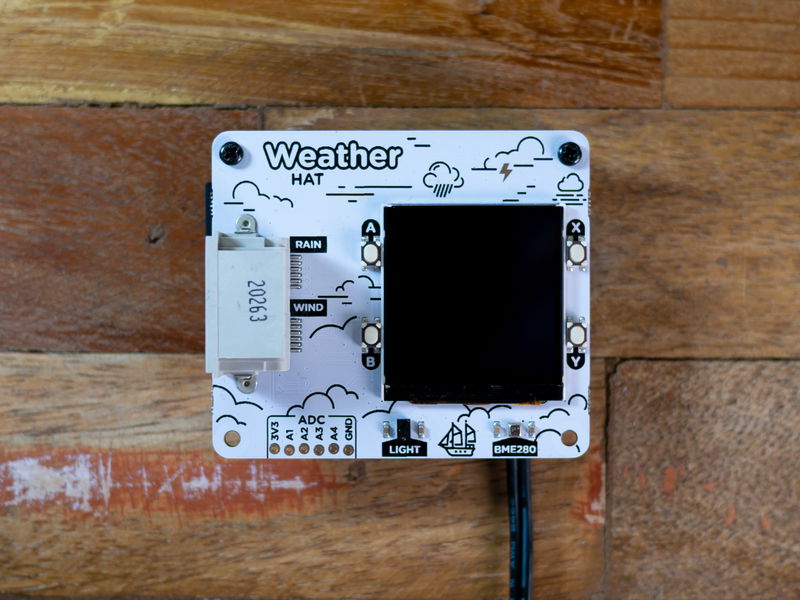
BME280 temperature, pressure, and humidity sensor
The BME280 is a neat little all-in-one weather sensor that measures temperature, pressure, and humidity. On Weather HAT, the BME280 sensor is at the right hand corner of the board, so as to be as far away from the Pi's CPU as possible. Our library measures temperature in degrees celsius, relative humidity as % water content of the air and atmospheric pressure in hPa (hectopascals).
LTR-559 light and proximity sensor
This sensor can read the ambient light level in Lux (a unit of light intensity) and can also act as a proximity sensor. The LTR-559 is the same sort of sensor that's next to the camera in your mobile phone that automatically dims and brightens the screen depending on the light level and disables the touchscreen when it's next to your ear.
Connectors for wind and rain sensors
The chunky grey connectors on the left hand side of Weather HAT are RJ11 connectors (you might remember these from when we had to plug 'telephones' into 'copper wires'). We've included them on Weather HAT so you can connect up a set of wind and rain sensors (sold separately). These sensors consist of a tipping bucket style rain gauge, an anemometer to measure wind speed and a wind vane to measure wind direction.
Wind and rain sensors are mechanical sensors made up of magnets, switches and resistors. The rain gauge and anemometer behave like digital switches that output repeated digital on/off signals - as if a diligent, weather monitoring gnome was frantically hammering a button to report the wind speed or how much it was raining. More frequent button presses mean more wind and rain!
The wind vane doesn't have a gnome - it has eight switches connected to differently sized resistors, which can be closed in various combinations depending on the position of the wind vane. It outputs one of 26 different voltages, which each correspond to a compass direction.
Our Weather HAT software library converts these signals into useful measurements - metres per second for wind speed, degrees for wind direction and millimetres per second for rain. If you'd like to know more about the nitty gritty of how the sensors work, you can find more info on the datasheet.
Onboard Nuvoton microcontroller
Reading the wind and rain sensors requires two things that a Raspberry Pi is not super good at - counting the frequency of electronic signals accurately without missing any and reading analog voltages (it's a powerful computer that fits into your pocket, it doesn't need to sweat the small stuff).
To make sure the signals from the anemometer and rain gauge are counted precisely, we've outsourced the job to a Nuvoton microcontroller chip. A microcontroller can count things without being affected by all the complicated processes that run in the background on a Pi. The Nuvoton also has analog to digital conversion built in, so we don't need a separate ADC chip to decode the analog signal from the wind vane.
We've broken out some unused pins on the microcontroller along the bottom of the board so you can use them to hook up more sensors if you want.
1.54" colour LCD (240x240)
Weather HAT is a full size HAT, which means there's room for a nice big screen, wahoo! The vibrant full-colour LCD on Weather HAT is same one we use on PicoSystem, with plenty of space for displaying data, menus, or status updates. The display is an IPS display, so it's great quality for a display of its size, and it's driven by SPI so you can update it pretty quickly.
We've got an all-in-one example that displays sensor readings from Weather HAT on the LCD, with the live readings and graphs of the most recent values. We'll show you how to run this example later.
How to attach Weather HAT to your Pi
Weather HAT will work with any Raspberry Pi that has a 40 pin GPIO header (that's all of them except the really early ones). You'll need to connect your Pi to the internet to install the software, so you'll probably want to use a model with built in Wi Fi for convenience.
If you're using a Raspberry Pi Zero W or 2 W, then it will need to have a 40-pin header soldered on. Soldering on headers is not hard (check out our soldering guide for tips if you've not done it before) but if you don't fancy it, you could use a full size Raspberry Pi or a Zero WH with pre-soldered header.
We've included a couple of standoffs to fasten Weather HAT securely to your Pi, to keep things nice and solid while you're pressing the buttons. Poke the screws up through the holes in the Pi next to the GPIO, and screw the standoffs on top.

To attach Weather HAT to your Pi, push the socket header on Weather HAT down onto the pin header on the Raspberry Pi as far as it will go. If you're using the standoffs, there'll be a bit of gap between the low profile socket header on the HAT and the Pi, this is fine.
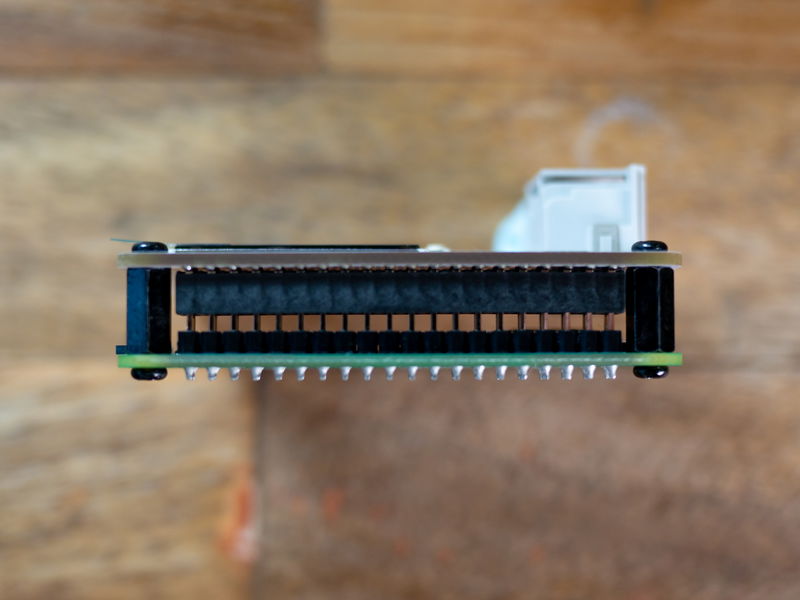
Add another pair of screws from the top of the HAT to secure everything in place. Here's what it looks like from the back, once everything is fastened together.
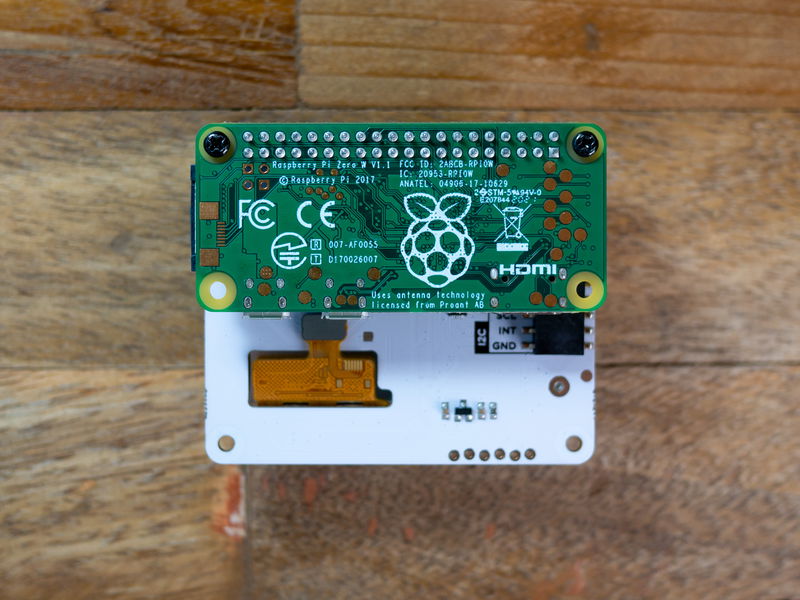
If you're using a big Pi and want to fix things together at the bottom edge of the Pi as well, we sell extra standoffs here.
Attaching the wind and rain sensors
If you're using wind and rain sensors, you'll need to attach them to their pole. The wind sensors mount on the double ended arm that goes on the top of the pole (note that the anemometer has a short cable which plugs into the wind vane, so that both wind sensors can then share the same long cable). The rain sensor is mounted on its own arm that comes out of the side of the pole. If you need step by step instructions for assembling the sensors, check out Sparkfun's excellent hook-up guide!
Plug the wires from the wind and rain sensors into the labelled connectors on Weather HAT. You can tell which sensors the wires come from by peering at the connectors - the RJ11 connector that comes from the wind sensors will have four wires inside it (two for each sensor!) while the rain sensor connector only has two. The wind cable is a bit thicker than the rain cable, because of the extra wires.
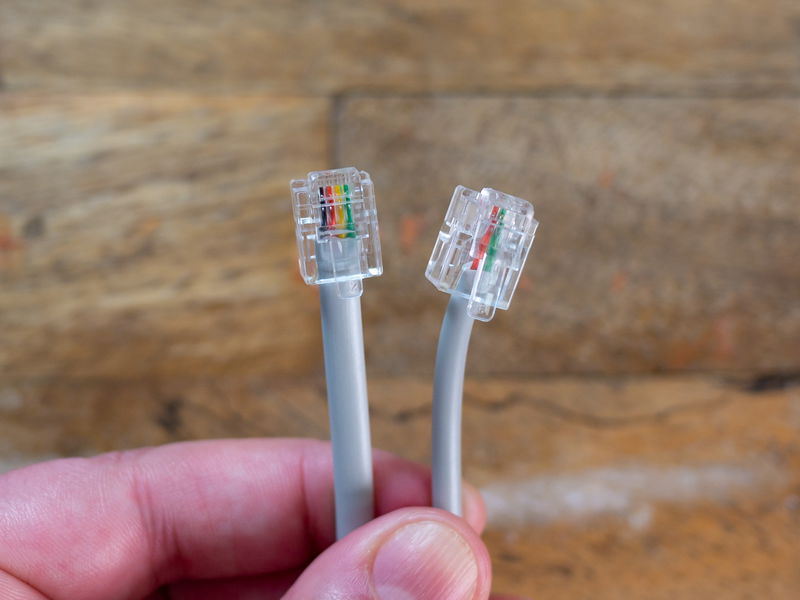
To get accurate measurements when you come to install the sensors in their final location, you'll want to check that the little spirit level bubble on the rain gauge is level, and the compass directions marked on the wind vane are pointing in the correct directions.
Lastly, carefully peel the protective film off the LCD using the little green tab (or you can leave it on to protect the display)
Installing the software
For this part of the tutorial, you'll need a micro-SD card that's been set up with a recent version of Raspberry Pi OS - we'd suggest using Raspberry Pi OS Bookworm or later. If you want, you can plug and a display, keyboard and mouse into your Pi for this step, but we're also going to show you how to set the Pi up 'headlessly', so you can log into it remotely from another computer. Being able to log into your Weather Pi remotely is particularly useful if you plan on doing something like mounting it outside on the top of a pole!
Installing Raspberry Pi OS
If you're a beginner, we'd recommend using a fresh image of Raspberry Pi OS Full (previously known as Raspberry Pi OS with Desktop). The Full/Desktop version includes many of the software dependencies you'll need to run the examples, so makes for a more straightforward install. It also means you can plug your Pi into a monitor and navigate around using the GUI if you need to.
To flash your SD card, download Raspberry Pi Imager to your computer (it's available for Windows, Mac OS and Linux) and fire it up. Select the Pi that you're using and the most recent version of Raspberry Pi OS and select your SD card. If you're not interested in logging into your Pi remotely, you can just click next, decline to apply OS customisation and, once it's cooked, pop the newly flashed SD card into your Pi.
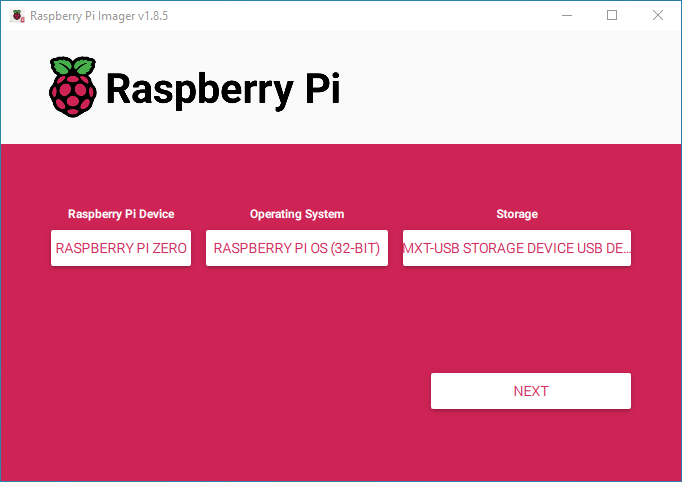
Wait for the Raspberry Pi desktop to appear, and follow the standard Pi OS onscreen instructions to configure your Raspberry Pi and connect it to wi-fi. If you need help with any of these steps, there's loads of useful info on the Raspberry Pi site.
Installing Raspberry Pi OS (with remote access)
If you want to set up SSH so you can log into your Pi remotely, Raspberry Pi Imager now makes that really easy. Once you click next you'll be given the option to edit the OS customisation settings (in older versions of Imager you can get to this menu by pressing Ctrl-Shift-X).
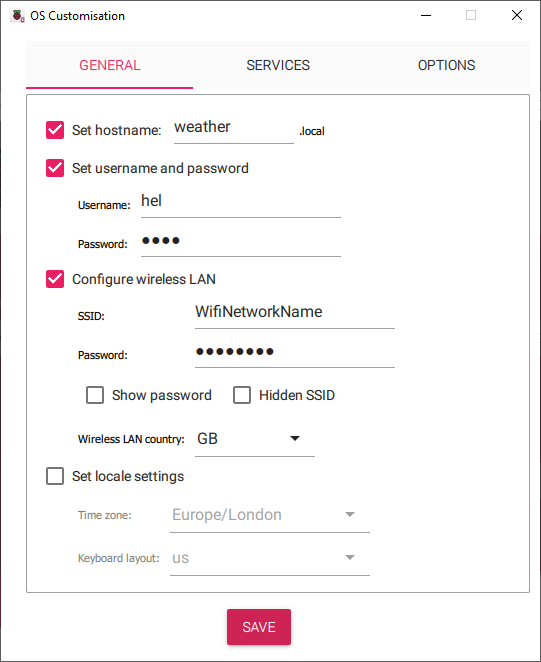
You'll need to select the following options -
- 'Set hostname' - this is the name that your Pi will show up as on your wi fi network. We're using
weather.local. - "Set username and password' - enter the username and password you want to use to log into your Pi. If your Pi is going to be located outside where there's a possibility someone can get at it, use something secure!
- 'Configure wireless LAN' - enter your wifi details here. Double check your SSID and password are entered correctly, both fields are case sensitive.
- Click the 'Services' tab and select 'enable SSH'.
- Once that's all done, close the OS customisation menu, write your SD card and pop it into your Pi.
To communicate with your Pi remotely, you'll need a SSH client installed on your computer or phone, we'll be showing you in Windows using PuTTY. If you're using a Mac, a Linux computer or Android/iOS, other SSH clients are available!
Once you've powered up your Pi, give it a couple of minutes to start up and start broadcasting its hostname (the first boot can take a while, especially if you're using a Pi Zero). Open up your SSH client and point it at your Pi's hostname - weather.local.
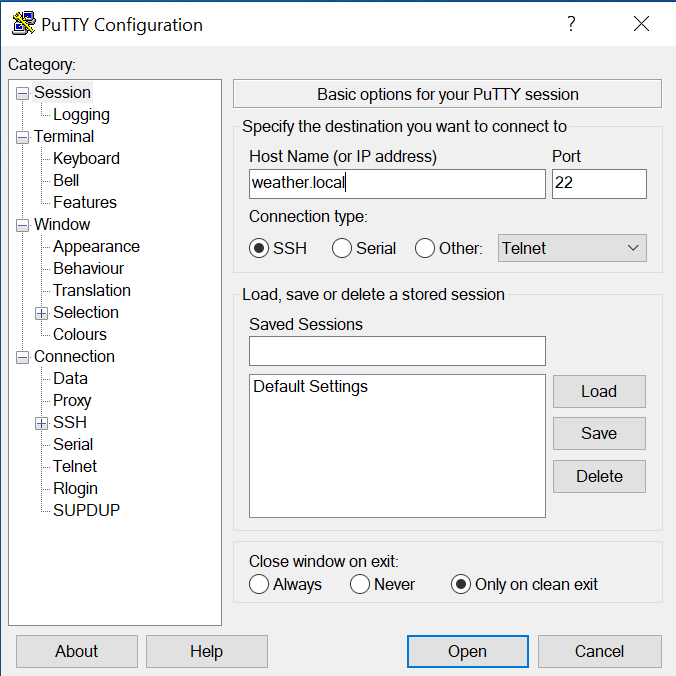
If your Pi is successfully talking to your Wi-Fi, you will get prompted to enter a username and password - the username is pi, and the password is whatever you set when you flashed the image.
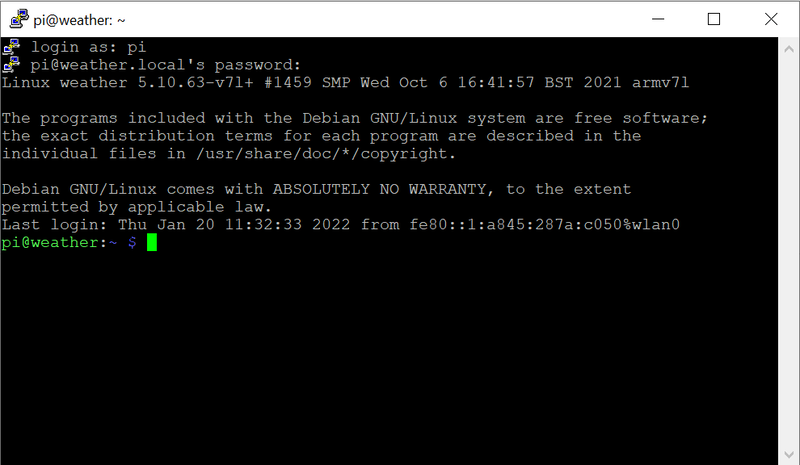
Boom - if that's all worked you should now have a terminal prompt that you can use to run commands on your Raspberry Pi.
Installing the Weather HAT Python library
In the terminal (if you're using the GUI, you can open up a terminal by pressing control-alt-t or find it in the menus) type the following:
git clone https://github.com/pimoroni/weatherhat-python
cd weatherhat-python
./install.sh
The install script enables I2C and SPI and downloads some other software that the Weather HAT library needs to work. It also (optionally) will set up a virtual environment for you, which you will need to be able to install Python packages in recent versions of Pi OS.
Once everything's installed it's a good idea to type sudo reboot to reboot your Pi and apply the changes to the Pi's interfaces.
Help! I'm using Raspberry Pi OS Lite
If you're using the Lite version of Pi OS, you may need to install some additional software before the commands above will work.
Try
sudo apt install python3-pip git libatlas-base-dev
Running the examples
To run an example, you'll first need to switch to your virtual environment - if you let our installer set one up you can type this command in the terminal to do that:
source ~/.virtualenvs/pimoroni/bin/activate
There are several examples in the examples folder within the weatherhat-python folder. In the terminal, type the following to look at the available examples:
cd examples
ls
When running the examples that follow, you can type control-c at any time to stop the example running.
You can run an example by typing the filename and then:
python weather.py
Let's take a look at some of the examples!
weather.py
weather.py is our advanced weather station example which demonstrates how to use readings from the sensors, the screen and the buttons in an application. The default screen is set up to show you readings from all the sensors, and pressing the X button will let you switch from numbers to little graphs. Tapping A will cycle through wind, rain, light and temperature specific displays.
If you want weather.py to start up automatically when you you start up your Pi without you having to run the Python script every time, you can use crontab to do that. First, type:
crontab -e
to set up a new crontab file. Press 1 when prompted to open the file in the nano editor.
Add the following line to the bottom of the file, it's Ctrl-X to close and 'Y' to save the file when you're done. We'll need to add the path to our virtual environment, followed by the path to the example. Our user account is called 'pi', but if yours is called something different you'll need to swap that out.
@reboot /home/pi/.virtualenvs/pimoroni/bin/python /home/pi/Pimoroni/weatherhat/examples/weather.py &
If you want to stop the script from starting automatically, just crontab -e again and remove or comment out the line you just added.
We've also added some simpler examples to demonstrate the separate functions of Weather HAT, which might help out if you want to start making your own application.
BME280 examples
The simple BME280 example grabs unmodified temperature, humidity and pressure readings from the BME280 sensor on Weather HAT. Run it with
python BME280.py
You'll see values being printed every second or so. Try touching the BME280 sensor and see how the temperature changes, and try breathing close to it to see how the humidity from your breath affects it.
Device temperature: 27.28 *C
Humidity:           27.76 %
Pressure:           1023.89 hPa
You'll probably find the temperature is quite a bit higher than you're expecting, and the humidity is lower. This is because the temperature reading is affected by heat from the Pi's CPU, as well as other ambient conditions. The good news is that Pi generated heat is usually pretty static, so compensating for it using a fixed offset is straightforward.
If you run the compensated temperature example, you should see some improvement. Type the following to run it:
python BME280-compensated.py
There's a variable in this example code that you can change to tweak how much the temperature is compensated. We recommend calibrating against an analog alcohol-type thermometer, if you have one.
Look for the line that says OFFSET and change this number until the temperature readings match with those from your thermometer. Different Pis put out different amounts of heat, and you might find that you need to adjust more or less depending on what kind of enclosure you're using and whether it's inside or outside. If you're using a Pi Zero outside in a well ventilated enclosure like a Stevenson screen, for example, you might not need much of an offset.
If you're using a Pi 4 or Pi 5 they tend to run rather warm. To reduce heat transfer you could use a GPIO extension cable to connect HAT and Pi to make more of a gap between them.
1.54" LCD example
The code that controls the little LCD is in the st7789 library. The main way to create frames that can be shown on the display is using the Python Image Library (PIL), which allows you to do all sorts of things like draw text to the display, draw shapes, draw individual pixels, and even apply effects like blurs.
lcd.py is a simple example that shows you how to write text on a coloured background to the LCD on Weather HAT. There's more examples of how to use PIL to display things on this screen in the ST7789-python library., like drawing images from files and even animating gifs on the LCD.
Adafruit IO example
adafruit-io.py is an example that shows how to post your data into a cloud data service so you can view it from anywhere - we've chosen Adafruit IO as it's really straightforward to set up a free account and incorporate the functions into your Python scripts.
You'll first need to register an Adafruit IO account to obtain a username and key. Open up adafruit-io.py in an editor ( sudo nano adafruit-io.py from a terminal) and edit the lines below to include your key and username.
ADAFRUIT_IO_USERNAME = 'YOUR AIO USERNAME HERE'
ADAFRUIT_IO_KEY = 'YOUR AIO KEY HERE'
Hit Ctrl-X and then press Y to save your changes.
You can now run the example with
python adafruit-io.py
The script will automatically set up a bunch of feeds associated with the sensors on Weather HAT, set up a new dashboard, and start posting data to the cloud 🌩.
Open up the dashboard URL in a web browser. There's nothing here right now, so lets make it a bit more interesting! Click on the cog icon in the top right of the screen, and select 'Create New Block'

There's a bunch of different blocks to choose from - we used a combination of line charts and gauges to set up the dashboard below. Once you select a type of block you'll get asked what feed/s to associate it with. You can move blocks around and resize them with 'edit layout'.

If you'd like to keep an eye on exactly what data's being posted in, you could add a stream block and add all your feeds to it:
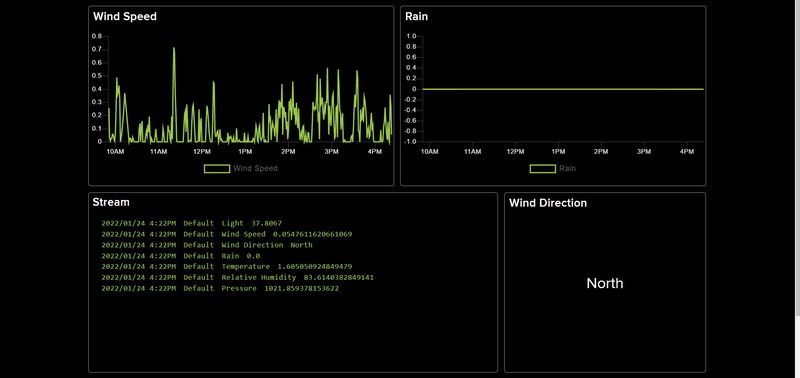
Adafruit IO's free tier lets you store data for 30 days and lets you post up to 30 data points a minute. Our example posts sensor data every 30 seconds, if you increase the frequency of updates you might see throttling errors. If you want to learn more about Adafruit IO, check out this getting started tutorial.
Next steps
Hopefully this tutorial should have provided a basic overview of Weather HAT and how to get started with the Python library.
If you're looking for a follow on project, why not try hooking your sensor data up to Weather Underground? If storing your data for 30 days is not enough, you could set up a InfluxDB database (with associated beautiful Grafana graphs) to store it as long as you like. If you wanted to incorporate Weather HAT into an Internet of Things network, you could set Weather HAT up to talk to Home Assistant using MQTT, and use the weather data to automate your lights to turn on and off or your heating to come on automatically.
We flippin' love looking at graphs at Pirate HQ, so drop us a line on Twitter and tell us what the weather's like where you are! 🏴☠️
Search above to find more great tutorials and guides.