Enviro and InfluxDB/Grafana
Enviro is a family of programmable data logging boards, powered by Raspberry Pi Pico W. They're designed to be easy to use and unobtrusive to have around your house, garden or workplace. They all have a deep sleep mode so that they can be run off battery for a long time without any annoying wires.
This guide will show you how you can use an InfluxDB database hosted on a Raspberry Pi to stash all the lovely data gathered from your Enviro boards. We'll also show you how to use Grafana as a front end for a nice dashboard with lots of awesome graphs.
This is an intermediate tutorial and will assume some familiarity with RP2040 boards and Raspberry Pi - if you're brand new to Enviro we'd suggestion having a read of our beginner Enviro tutorial first.
This quick guide will cover:
About InfluxDB/Grafana (and why hosting your own database is great).
How to install InfluxDB and Grafana on a Raspberry Pi.
How to provision Enviro boards to post data into it.
How to set up a Grafana dashboard.
What you'll need
A computer to program Enviro from
A Raspberry Pi, power supply and SD card (you don't need a monitor, keyboard or mouse for your Pi, as we'll be connecting to it via SSH).
About InfluxDB
In our previous tutorial, we showed you how to post data into Adafruit IO - a cloud data service. If you've tried posting frequent updates, or hooking up more than one board, you might find that you run into the limits of the free account fairly quickly though!
By DIYing your own local data storage solution you can stash as much data as you like, for as long as you like, without worrying about data rates and limits - woo!
InfluxDB is a time series database, which means each datapoint is saved with an associated timestamp. This means it works really well with Enviro's method of saving up a bunch of readings and posting them all at once.
Grafana is a powerful web front end for building data dashboards and making data pretty and accessible, with oodles of customisation options.
We'll be installing the self-hosted, open source version of InfluxDB on a Raspberry Pi. If you'd rather use the cloud version (which makes it easier to access your data from anywhere, in exchange for some data rate/storage limitations or money) you can find instructions on how to set that up at the link below.
Installing InfluxDB and Grafana
You can install InfluxDB on a bunch of different kinds of computer, but putting it on a Pi means you have a nice small, low power consumption server that you can put in a cupboard or on a shelf and forget about.
We used Sandy's excellent tutorial to learn how to install InfluxDB and Grafana on a Raspberry Pi. He uses a Raspberry Pi 4, but the previous generation of Raspberry Pi will also work fine if you have one spare - our database is running on a Pi 3B+.
We flashed our SD card with the most recent version of Raspberry Pi OS Lite (Bullseye) using Raspberry Pi Imager, and followed along with the rest of the instructions.
When we got to the last 'save and test' step, we got an error message because our database didn't have any data into it. Check your details are correct, and if they are, move on!
Provisioning Enviro boards for InfluxDB
Updating your Enviro firmware
If you don't have access to the InfluxDB options when you provision Enviro, you'll need to update your firmware. Note that updating will delete any files on the device, so you might want to back up any important details/readings first. Here's how to update it:
Download the latest Enviro .uf2 from the releases page.
Plug Enviro into your computer.
Hold down the BOOTSEL button on Enviro and hit RESET to put the board into DFU mode.
Copy the .uf2 file across to the new RPI-RP2 drive.
After a few seconds, Enviro should start up in provisioning mode (with the white activity LED flashing quickly).
Provisioning
Connect to Enviro's wireless portal from your phone or other wi-fi enabled device. We then gave Enviro the following details:
A nickname for our device.
Our wireless network details.
How often to take readings, and how often to post them to your database. Remember more frequent uploads means higher battery usage!
You'll need to input the following details once you've selected your endpoint:
URL - this should be the IP address or hostname of your InfluxDB database, followed by port 8086 (it should look something like
http://influxdb.local:8086orhttp://192.168.0.1:8086- note http not https!) Bucket - should be the name of the database you created when you installed InfluxDB -homeif you were following along with Sandy's instructions!
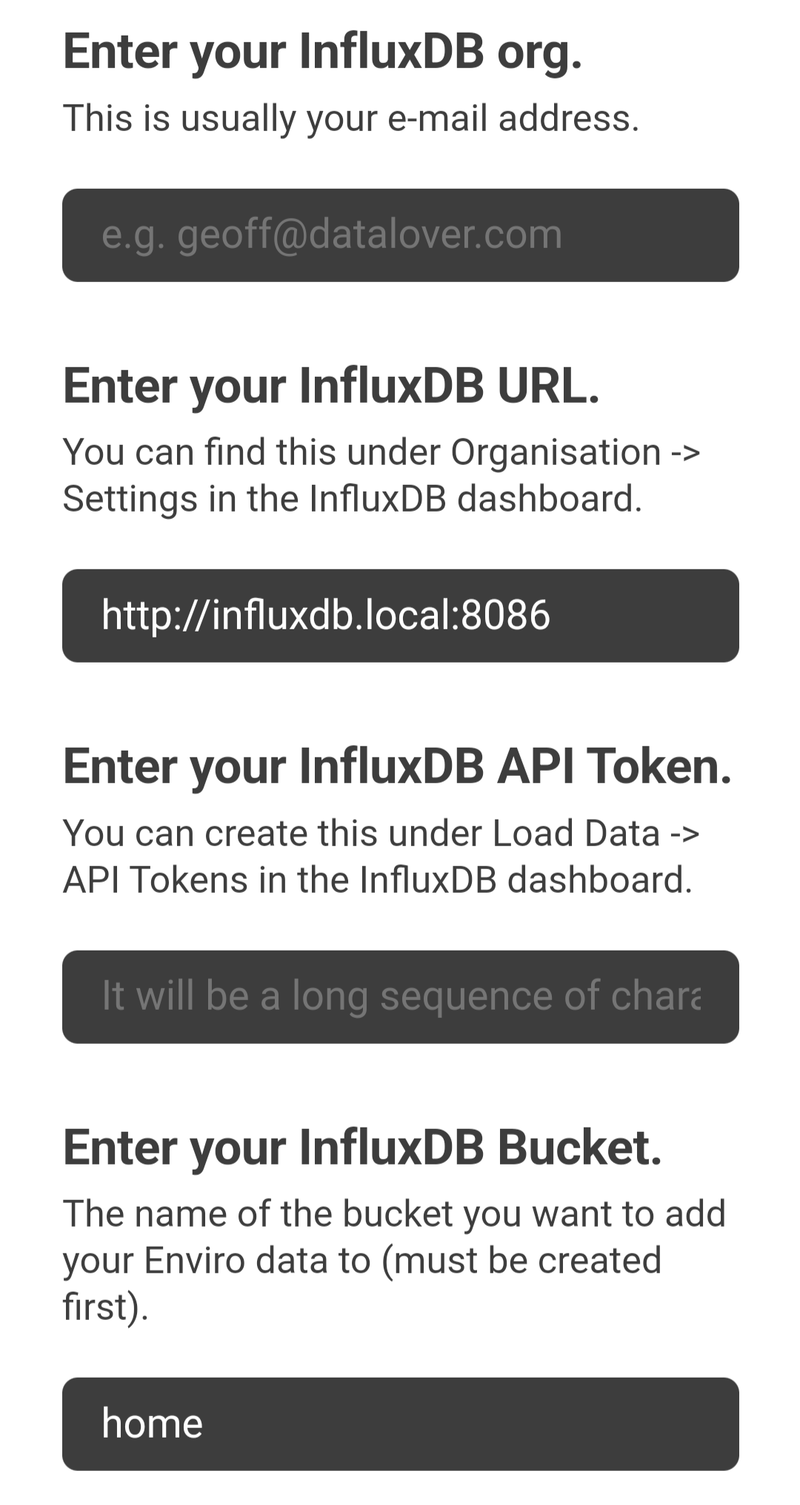
As we're posting our data into a local InfluxDB instance, you can leave the other two fields blank.
Once you've reached the end of the provisioning process, you'll get a 'Reset the board' button. When you press that, the board will go to sleep for the interval you specified above, and then wake up and take a reading. If you're posting data in every few readings, you might want to press the poke button a few times to make sure it connects to the wifi and posts some data.
Configuring Grafana
Now for the fun bit! Navigate to your Grafana front end using a web browser (the address will look something like http://influxdb.local:3000/ or http://192.168.0.1:8086.
Setting up a test query
To check you have Enviro data in your database, lets set up a quick query - click on the 'explore' tab. Click on select_measurement - if everything's hooked up successfully this should open up a list of parameters relating to the different reading types.
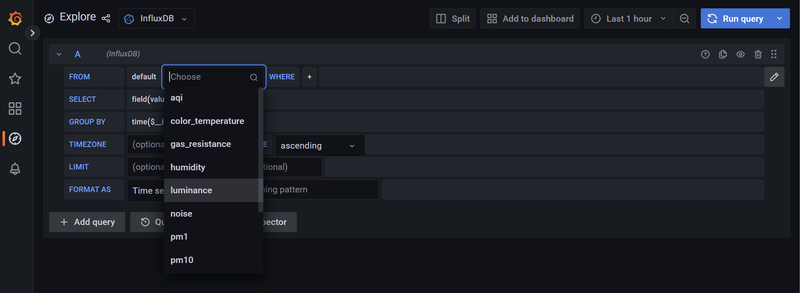
Click on a parameter to view the associated data in your database.
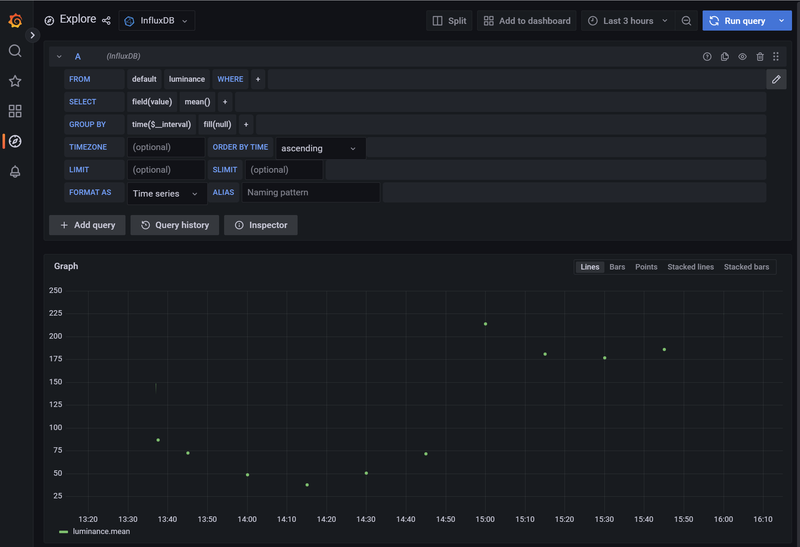
If you don't see parameters or data, try going back into 'Configuration' > 'Data sources' and double check the InfluxDB details are correct.
Setting up a dashboard
Once you've confirmed you've got data in your database, create a new dashboard by mousing over 'Dashboards' in the bar on the left and click on 'New Dashboard'.
To add a graph, click on 'Add a new panel'. You'll need to set up a query as before, by choosing a parameter under select_measurement. If you have more than one Enviro posting data into your database, you'll also want to specify what device the data is coming from - you can do that by clicking on the + after WHERE and selecting the appropriate device.

If you want to add another set of readings to the same graph, make a duplicate query (there's a button to do this next in the top bar of the query) and change the device details. Here we've also added an ALIAS to each query, so we can tell the devices apart.
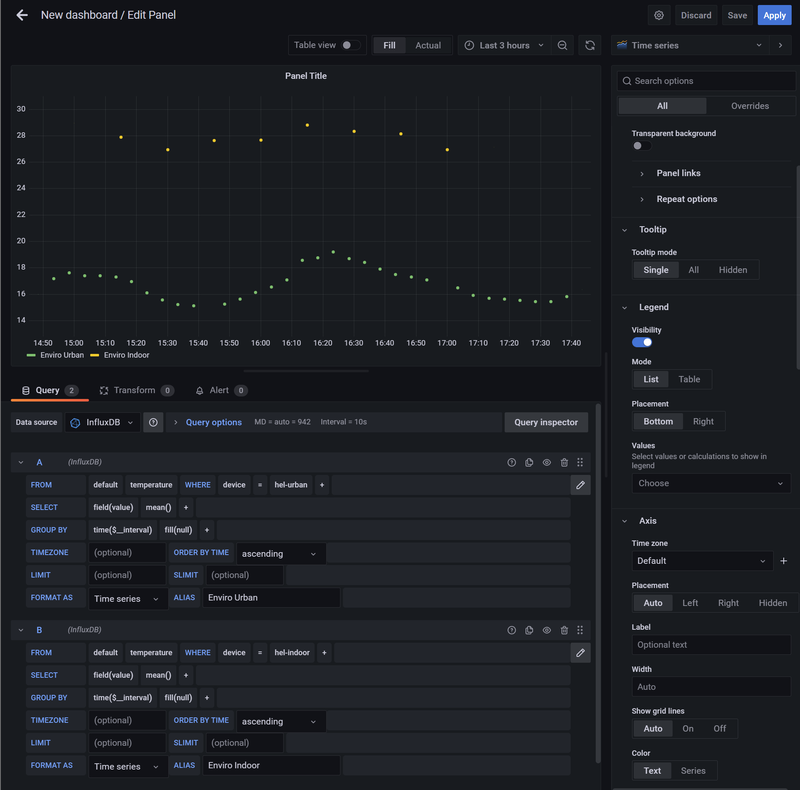
There's a bunch of options in the box on the right that you can use to customise your graphs. Here we've:
given the panel a title under 'Panel options' > 'Title'.
Selected 'connect null values' to turn our dots into a line.
Turned on 'Gradient mode' > 'Opacity' to make things a bit more colourful.
Labelled our axis under 'Standard Options' > 'Unit'.
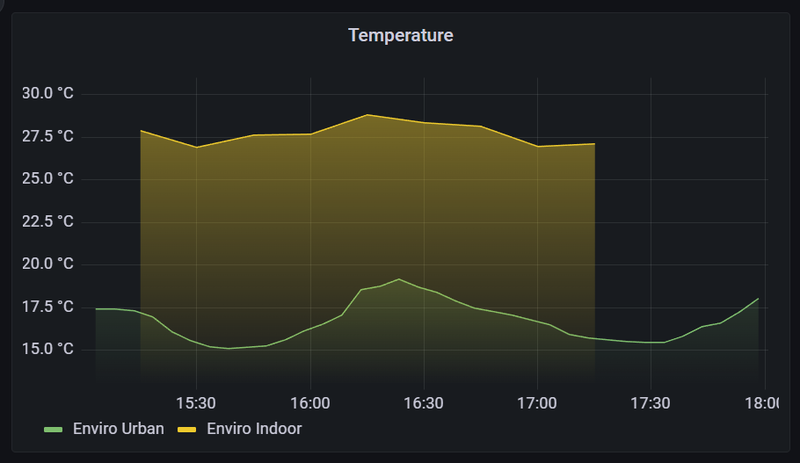
Make sure to click the save dashboard button in the top menu bar when you're done!
Applying a moving average
Sometimes it's useful to smooth out spiky graphs so you can filter out noise and concentrate on overall data trends. You can do this easily in Grafana by adding a moving average.
Our indoor temperature graph is showing some bumps from when Enviro sends its data and gets a bit warmer:
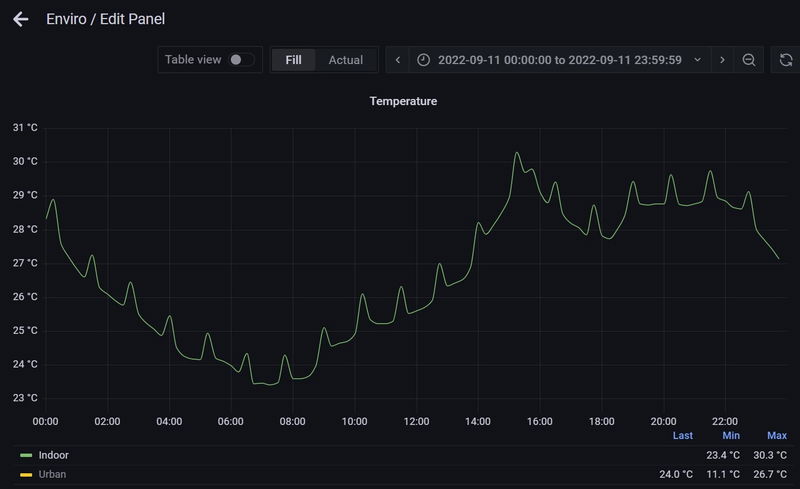
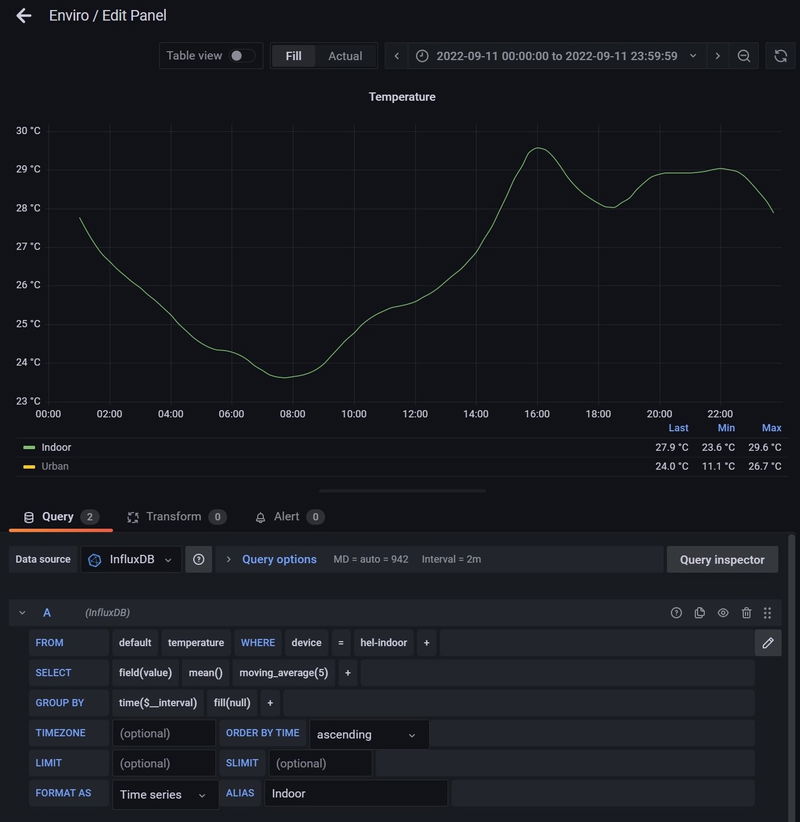
Here we've added a moving average by clicking on the + on the SELECT line of the query, and searching for moving_average in the box. We've changed the number to 5 - this is the number of datapoints that are used to calculate the average. The higher the number, the more smoothing will be applied.
Adding min/max values
Graphs are great, but we like seeing numeric values too. We've added the minimum and maximum values to show up next to the sensor alias, as well as the last value received. The options to do this are under 'Legend' in the right hand box.
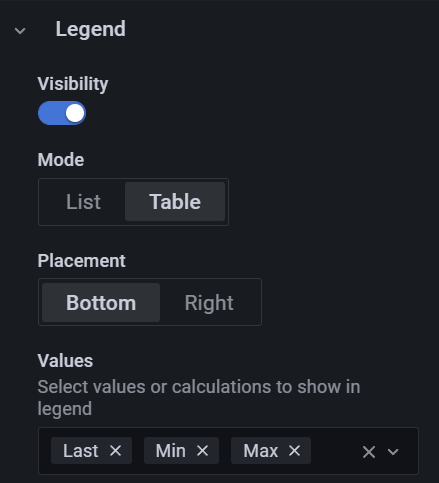
Looking good, data legend!
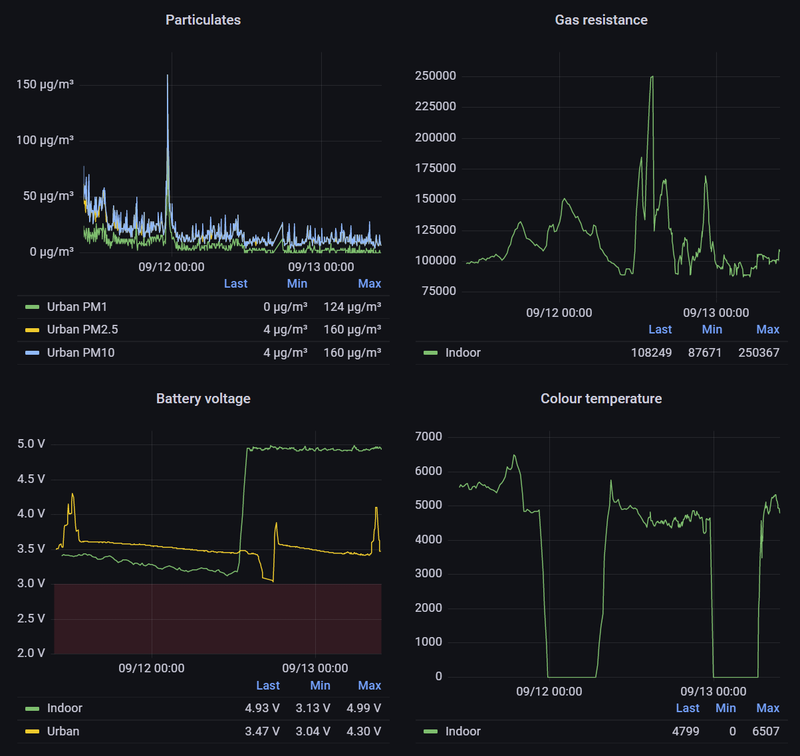
If you'd like to view a couple of days of our data, check out the snapshot link below.
Next steps
Hopefully this guide will have helped you set up your own data vault and encouraged you to start experimenting with different ways to display data.
Now that all your data is safely stowed in an easy to query database, there's a ton of things you could do with it - build a smart home display showing the results from database queries? Hook your database up to an automation system like Home Assistant and get it to turn your lights on and off automatically? Start getting into serious data analysis using Python or R? Keep exhaustive local weather records and lobby your evil government about climate change?
Drop us a line on Twitter or the forums and let us know what you're plotting!
Search above to find more great tutorials and guides.